BuySell2.0 Indicator — Free MT4 Crossover Strategy
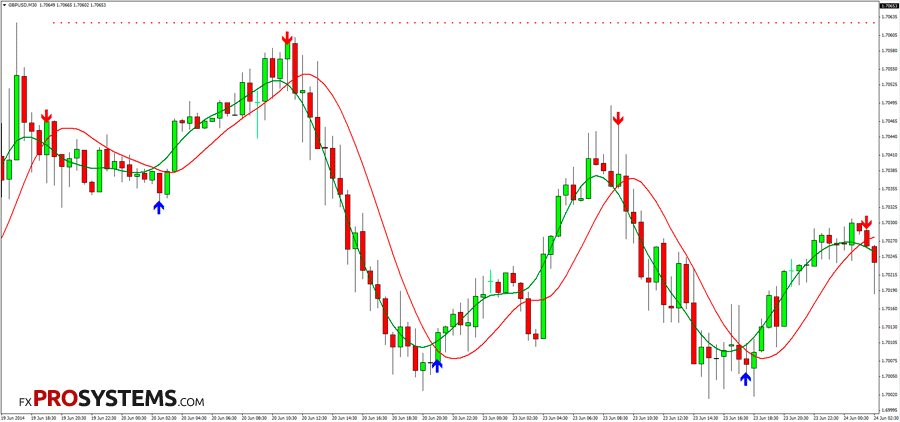
BuySell2.0 strategy is based on the main indicator, Buy-Sell_Alerts, which shows the direction of price movement using arrows. You enter a position when the corresponding arrow appears, and exit when an arrow in the opposite direction shows up. Simple and effective.
Characteristics of the strategy BuySell2.0
- Type of strategy: Indicator
- Platform: Metatrader4
- Currency pairs: Any
- Trading Time: Round the clock
- Timeframe: Any, recommended M30 or higher
- Recommended broker: Roboforex | XM | VT Markets
Rules of the strategy BuySell2.0
- Open a short position when a red down arrow. Exit when a green reverse arrow.
- Open a long position when a green up arrow. Exit when a red reverse arrow.

Putting it into practice
Say you're watching EURUSD on the H1 chart with a 100-period MA also plotted. Price is trading above the MA (uptrend bias), and a green up arrow prints. Because you're filtering by trend direction, you only act on green arrows here — the red ones get ignored, no matter how clean they look, since they'd be counter-trend. You enter long, and exit either on the reverse red arrow or your own predefined Take Profit, whichever comes first — don't wait indefinitely for the reverse signal if price has already moved well into profit.
A note on repainting: the signal here comes from the crossover of two underlying lines — Snake (which repaints) and T3 Clean (which doesn't). Since the arrow marks the crossover point between them, and one of those two lines can shift, the arrow can shift too. This isn't a hidden flaw — it's a direct, logical consequence of how the system is built.
In practice, this matters less on higher timeframes (M30+, as recommended above) than on M1-M5, where the underlying lines move constantly. Pairing this with a 50 or 100-period moving average filter — only taking signals in the direction of the MA — cuts down on a lot of the false/shifted signals. If you want something with a similar crossover logic but without the repaint, look for a "2MA Crossover with Price" style indicator instead.
As with any signal-based system, position sizing matters more than the signal itself. Risking 1-2% of your account per trade, regardless of how confident a given arrow looks, is what actually determines whether repaint-related false signals cost you a bad week or wipe out your account.
FAQ
It means a signal (like an arrow) can change or disappear after it first appears on the chart — so what looked like a clear buy/sell signal a moment ago might shift or vanish by the time you act on it. It's a common trait of indicators built on line crossovers, like this one.
Yes, to some degree — the arrow is based on a crossover between Snake (which repaints) and T3 Clean (which doesn't), so the arrow itself can shift. It's less of an issue on higher timeframes (M30+) with a moving average filter added, as explained above.
It wasn't built specifically for binary options — this is a Forex crossover strategy, and the arrow-shift behavior described above makes it a riskier fit for the fixed expiry windows binary options trading requires. If you want something purpose-built for binary options, check our Binary Options Indicators collection instead.
No — only the compiled .ex4 files are in the archive. You don't need to compile anything yourself; just drop them into your MT4 Indicators folder.
What's actually in the archive
The four files work together as a system, not four separate indicators to pick from:
- T3_clean.ex4 is a version of the T3 Moving Average, a well-documented smoothing technique published by Tim Tillson in Stocks & Commodities magazine back in 1998. It's built from a weighted chain of exponential moving averages, designed to track price closely with less lag than a standard MA — and it doesn't repaint.
- Snake.ex4 is a similar adaptive line, but less standardized — this is the component that does repaint, and it's the source of the arrow instability discussed above.
- Uni_cross.ex4 is what actually detects when Snake and T3 Clean cross each other and turns that crossover into a visual signal.
- Buy-Sell_Alerts.ex4 ties it together into the arrows and alerts you see on the chart.
Knowing this, the repaint behavior makes complete sense: you're watching for a crossing point between one stable line (T3) and one that keeps moving (Snake) — so the exact crossing point can shift until Snake settles down.
In the archives BuySell_2.0.rar:
- Buy-Sell_Alerts.ex4
- Snake.ex4
- T3_clean.ex4
- uni_cross.ex4
- buysell2.0.tpl
- BuySell2.0 Installation Guide.pdf
Free Download BuySell2.0







 I did not understand your question

