Harmonic Pattern Indicator — Gartley & Butterfly Pattern Scanner for MT4

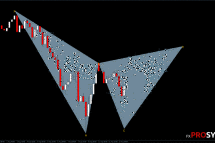
Harmonic Pattern Indicator identifies two related but distinct harmonic patterns — Gartley and Butterfly. The Gartley pattern was first described by H.M. Gartley in his 1935 book Profit in the Stock Market; the Butterfly pattern is a later variation with different Fibonacci ratios. Both rely on precise geometric price relationships based on Fibonacci levels. Gartley Butterfly Pattern feature is that it is a model that has certain exact contours and mathematical relationships. That is, here we have to deal with the Fibonacci levels.
Characteristics of Harmonic Pattern Indicator
- Platform: Metatrader4
- Currency pairs: Any
- Trading Time: Any
- Timeframe: Any, recommended H1 and higher
- Recommended broker: Roboforex | XM | VT Markets
How harmonic patterns work
Both patterns follow the same X-A-B-C-D structure — five points connected by four price swings — but each has its own precise Fibonacci ratios defining a valid setup:
- Gartley: AB/XA ≈ 0.618, BC/AB ≈ 0.618, CD/BC ≈ 1.272, AD/XA ≈ 0.786
- Butterfly: AB/XA ≈ 0.786, BC/AB ≈ 0.618, CD/BC ≈ 1.618, AD/XA ≈ 1.270
Gartley and Butterfly aren't the only harmonic patterns out there — the same X-A-B-C-D logic underlies several related patterns with their own ratio sets, most notably Bat (AB/XA ≈ 0.382, AD/XA ≈ 0.886) and Crab (AB/XA ≈ 0.618, AD/XA ≈ 1.618, the most extreme of the group). This indicator only scans for Gartley and Butterfly — if you want Bat or Crab coverage too, you'll need a separate tool, since the ratio logic (and therefore the detection code) is different for each pattern family.
The core idea: if a price swing retraces by close to these exact ratios, the theory holds that point D (the pattern's completion) is a statistically favorable zone for a reversal. The indicator does the ratio-checking for you and flags valid setups automatically — you don't need to calculate any of this by hand.
How to trade a signal
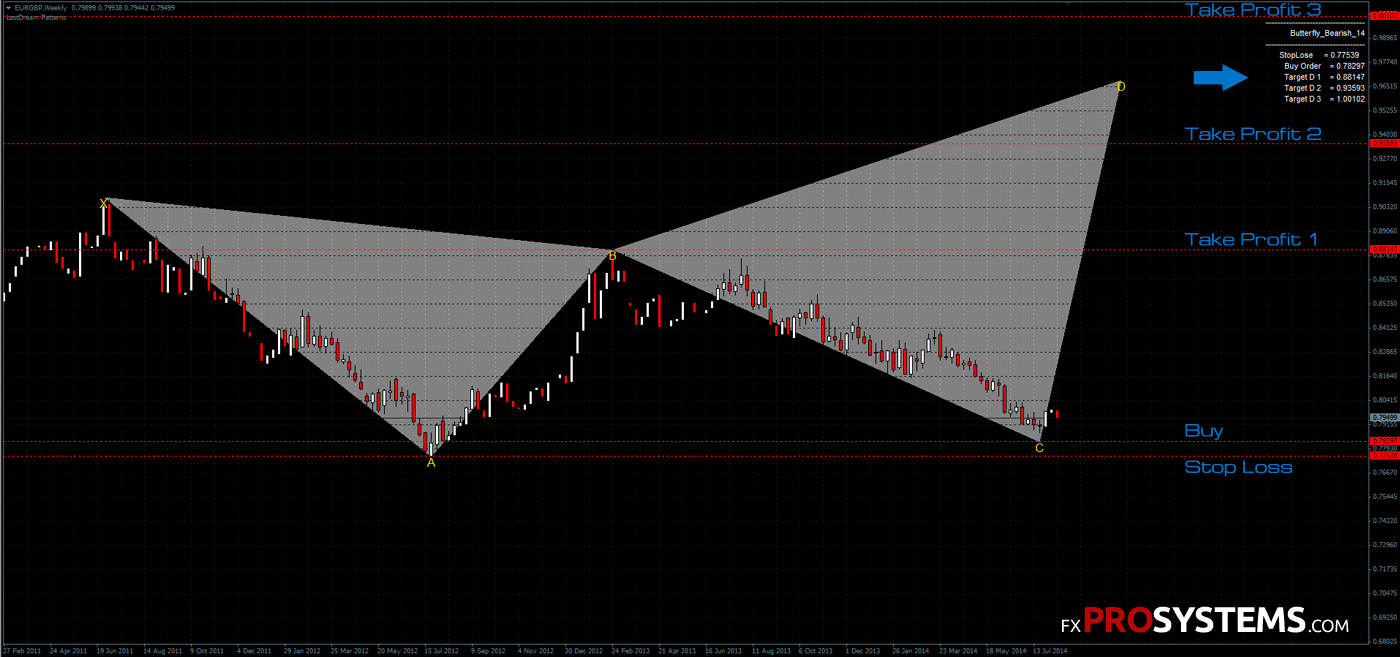
Once a pattern completes at point D, the indicator marks your entry, Take Profit, and Stop Loss directly on the chart (top-right corner, as shown above). The general logic: enter in the direction of the expected reversal once D is reached, place your Stop Loss just beyond the D point (since a break past it invalidates the pattern), and take profit at Fibonacci retracement levels of the C-D leg — typically 38.2% and 61.8%. Because this is a reversal strategy, it works best on higher timeframes (H1+, as recommended above) where the geometric structure has more room to play out reliably.
Harmonic Pattern Indicator finds the on the chart pattern and additionally shows in the upper right corner of the entry point, targets for the Take Profit and level for Stop Loss:
How to install
The archive's already organized to match your MT4 folder structure — copy the MQL4 folder from the archive straight into your MT4 Data Folder (File → Open Data Folder), then restart MT4. To apply it correctly, load it via the included template: right-click your chart → Template → Load Template → select Harmonic Pattern Indicator.tpl. That applies the indicator with the right settings in one step, rather than dragging the raw .ex4 file onto the chart.
Why does a pattern sometimes disappear after it appears? That's not a bug — it means price action broke one of the pattern's required conditions before it fully completed. Don't expect to see a pattern on every timeframe at every moment; when nothing's shown, it simply means no valid setup currently exists.
In the archives Harmonic_Pattern_Indicator.rar:
- Harmonic Pattern Indicator.ex4
- Harmonic Pattern Indicator.tpl
Free Download Harmonic Pattern Indicator