Quantum Queen X EA — new crown, same grid underneath
Regular readers of this site know the drill by now: this is the same developer behind Quantum King and Quantum Athena, and this time the subject is his flagship — or rather, his flagship's successor. The original Quantum Queen appears to have been discontinued; a third-party review published just days ago explicitly calls it “the discontinued Quantum Queen” while describing its replacement. In its place: Quantum Queen X, published 14 July 2026, already at 64 purchases a month and a near-perfect 5.0 rating from its first 43 reviews. I ran four backtests across its risk presets, dug through its live signal's own published statistics, and found something in the last two weeks of the test that I think every prospective buyer needs to see before they read a single review. Here's what I found.
Characteristics of the Quantum Queen X EA MT5 v4.3
- Official page: MQL5
- Platform: Metatrader5
- EA version: 4.3
- Currency pair: XAUUSD (Gold) only
- Trading hours: 24/5
- Timeframe: M15 (managed internally by the EA)
- Minimum deposit: $500 official minimum, $1,000 recommended (tests used $1,000)
- Account type: hedging
- Recommended brokers: Roboforex | XM | VT Markets - excellent for GOLD — ECN/RAW accounts
- VPS: required for continuous 24/5 operation
- Price: $1,199.99 (rises $50 every 10 purchases, final price $1,999) and FREE here ↓
How does it work?
The product page is candid about the mechanics, more so than most: Quantum Queen X is “an elite trend-following grid system that builds positions intelligently, following structured market momentum.” The headline new feature is Custom Mode — instead of a fixed preset, you can individually enable or disable any of the 12 built-in strategies, and the default configuration now runs 9 of them instead of the previous version's 7.



But the part that matters most for risk isn't in the marketing copy — it's in the developer's own reply to a review, buried on page two of the comments. A buyer described what looked like a string of losing trades in their history. In response, the developer explained the underlying philosophy: individual legs aren't meant to be judged in isolation. They belong to a larger recovery cycle, and success or failure is only measured once that whole cycle finishes — the strategy is built around bringing the group of trades to an overall profit, not around avoiding losses on any single one of them.
This is exactly what I found sitting in the raw backtest data, in the most recent two weeks of an eight-year test.
Testing — and the event in the last two weeks
I ran four backtests: RoboForex-ECN, XAUUSD, M15, 2018.01.01–2026.08.22, $1,000 starting deposit, 100% history quality — covering the Default preset, two fixed-lot variants (Fixed and Fixed-per-balance), and the Very High Risk preset.
XAUUSD M15 | 2018 – 2026 | $1,000 | Default settings
XAUUSD M15 | 2018 – 2026 | $1,000 | Fixed lot
XAUUSD M15 | 2018 – 2026 | $1,000 | Fixed lot per balance
XAUUSD M15 | 2018 – 2026 | $1,000 | Very High Risk
| Preset | Deposit | Net profit | Profit Factor | Balance DD max | Equity DD max |
|---|---|---|---|---|---|
| Default | $1,000 | $23,383,292.34* | 4.26 | 19.29% ($3,588,233.40) | 76.92% ($14,317,211.40) |
| Fixed lot | $1,000 | $6,093.04 | 4.86 | 1.68% ($116.52) | 6.68% ($464.92) |
| Fixed per balance | $1,000 | $396,255.23* | 4.77 | 11.61% ($40,199.40) | 46.32% ($160,397.40) |
| Very High Risk | $1,000 | $172,963,270.90* | 5.37 | 3.51% ($5,826,000.00) | 14.00% ($23,246,000.00) |
* Net profit at the higher-scaling presets is inflated by auto-lot compounding on a growing balance and isn't a realistic withdrawal figure — it's included to show how the risk scales, not as a return you'd actually see.
The Fixed lot test is the only one that isolates the strategy's actual trade selection from position-sizing effects, and it looks genuinely fine — 4.86 profit factor, single-digit drawdown. But every other preset — including the Default one most buyers will actually run — shows the same pattern that should worry you: balance drawdown and equity drawdown diverge enormously. On the Default preset, balance only ever dipped 19.29% at its worst, but equity — which includes the floating loss on positions still open — dropped by 76.92%. That gap is the whole story of this EA.
What actually happened
Late in the balance/equity curve there's a near-vertical collapse — the kind of chart pattern that makes you stop scrolling. I went digging in the raw deal-by-deal data to find out exactly what happened there, and the sequence is fully documented, down to the cent.
The equity curve's near-vertical collapse in the final weeks of the test.
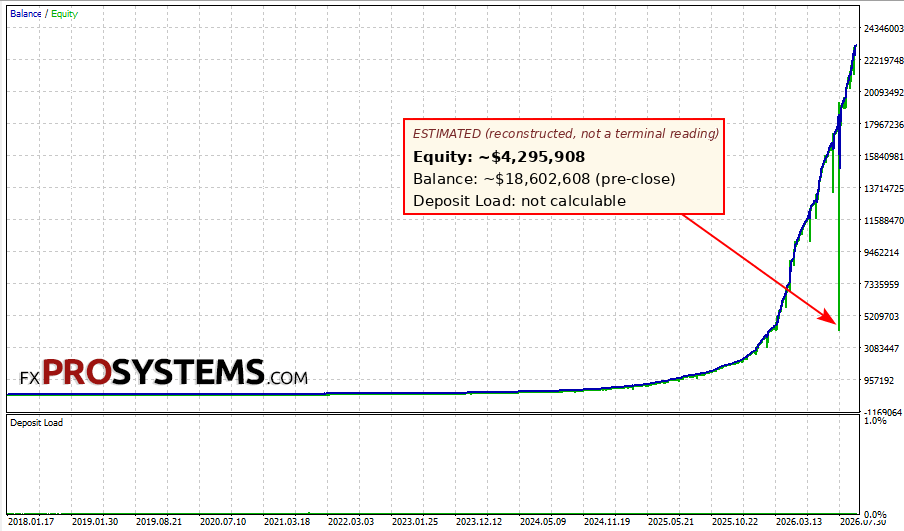
Based on the report's Equity Drawdown Maximal (76.92%, $14,317,211.40), the trough of this collapse can be reconstructed: the peak before the basket closed was roughly $18.6M (the balance at deal #7802), putting the estimated equity trough at roughly $4.3M. This is a reconstruction from the report's aggregate statistics, not an exact value the terminal recorded at that specific tick.
| Field | Value |
|---|---|
| Basket opened | 2026.07.29, 22:00–23:00 — gold falling from ~$4,107 to ~$4,045 |
| Position built | 15 sequential "buy in" legs, lot size scaling up to 307.95 lots per leg, all added as price kept falling against the position |
| Basket closed | 2026.07.30, 01:05 — all 15 legs closed within the same minute |
| First 7 closes (realized) | -$788,967.90, -$742,159.50, -$611,588.70, -$507,501.60, -$416,964.30, -$307,642.05, -$213,409.35 |
| Final 8 closes (realized) | +$155,822.70 → +$908,144.55 (each larger than the last) |
| Net result of the basket | +$382,781.85 — the cycle closed in profit |
| Reported Equity DD at this point | 76.92% of account equity |
Two of those seven realized losses — -$788,967.90 and -$742,159.50 — are, respectively, the single largest losing trade in the entire 8.5-year test and the second largest. They happened two and a half weeks before this backtest report was generated. This is not a rough patch from a difficult year buried deep in the history — it's the most recent significant event in the whole test, and the test period ends barely a month before today's date.
The basket survived because gold reversed in time and the later, larger legs closed profitably enough to cover the first seven catastrophic losses. That's not a strategy working as designed so much as a coin landing on the right side. If gold had kept falling for even another hour, the math on those first seven legs would have kept compounding, and the “76.92% equity drawdown” figure in the report could easily have become “100%.” This is precisely the mechanism the developer described in that review reply — the cycle is designed to be judged as a whole, and individual legs are not stopped out, whatever their size.
The live signal — and the parts that don't add up
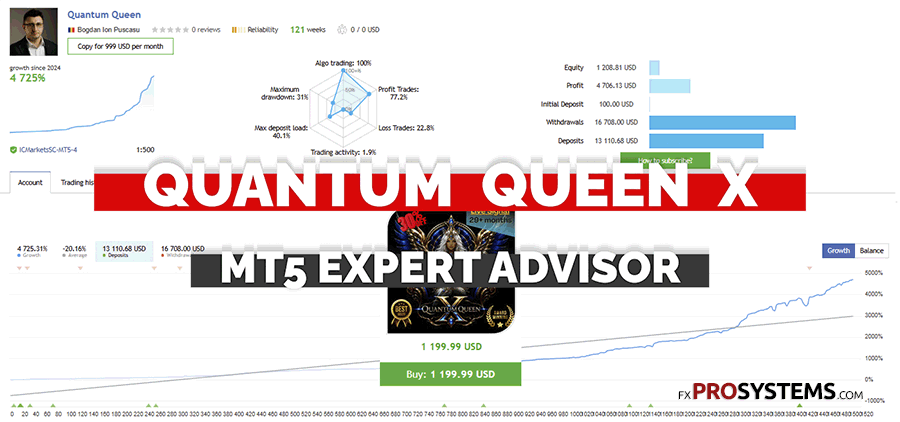
The product page links to a “live” signal that it describes as showing more than two years of steady gains. I pulled its published statistics directly from MQL5.
| Metric | Value |
|---|---|
| Initial deposit | $100.00 |
| Deposits added since | $13,110.68 |
| Withdrawals | $16,708.00 |
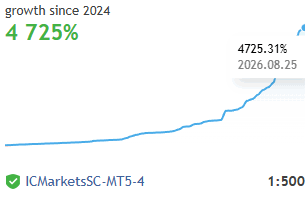
| Displayed "Growth" | 4,725.31% |
| Current balance | $1,208.81 |
| Drawdown by Balance (relative) | 11.16% |
| Drawdown by Equity (relative) | 31.00% ($1,870.26) |
| Sharpe Ratio | 0.20 |
| Trading Days | 241 of 121 weeks (28.42%) |
| Current subscribers | 0 |
| Reviews | 0 |
That headline “4,725% growth” figure is doing a lot of work for a $100 starting deposit. But this account has had $13,110.68 deposited into it since it started — over 131 times the initial stake. MQL5's own growth calculation is based on the equity curve relative to deposits and withdrawals, so this isn't necessarily a deliberate trick, and I want to be fair about that. But it does mean the eye-catching growth percentage reflects a heavily topped-up account, not $100 organically compounding into thousands — and that distinction matters enormously to anyone deciding whether to pay $999/month to copy it.
The same balance/equity divergence pattern from the backtest shows up here too: only 11% drawdown by balance, but 31% by equity — a smaller-scale echo of the same floating-loss mechanic. And the signal's own system log tells its own story: repeated “Too frequent deals may negatively impact copying results” warnings (logged 7 separate times between early August and August 18 alone) alternating with “No trading activity detected… for the last 6 days” warnings (logged 4 times between May and July). A signal that swings between “too many trades to copy reliably” and “no trades for six days straight” is not one I'd want to be paying a monthly subscription to mirror in real time. Zero people are currently subscribed to it, and it has zero reviews — for a signal attached to a product with a near-perfect 5.0 rating and 64 sales a month, that gap is worth sitting with.
Quantum Queen vs. Quantum Queen X — what changed, and will X meet the same fate?
What's the same: the core engine. The product page says so directly — it describes Quantum Queen X as running on the same underlying engine that powered Quantum Queen. Same grid-based, trend-following logic. Same “the cycle is the unit, not the trade” philosophy, confirmed by the developer's own words above. Same XAUUSD-only focus, same hedge-account requirement, same mandatory VPS.
What's different:
| Field | Quantum Queen (118805) | Quantum Queen X (185687) |
|---|---|---|
| Strategies | 7 in default preset, 6 per some reviews | 9 in default preset, 12 total |
| Customization | Fixed presets only | New Custom Mode — enable/disable individual strategies |
| Broker presets | Mostly tuned around IC Markets | 4 presets for 4 different brokers |
| Reviews | 700+ accumulated over ~2 years | 43, all within about 6 weeks |
| Price at launch | Rose over time toward $1,999.99 | Started lower, same $1,999 ceiling |
Will Quantum Queen X meet the same fate as Quantum Queen? Nothing in what I found gives me a reason to think it structurally can't. The engine underneath is described by its own creator as unchanged. The event I traced in the backtest — a basket built entirely of legs that moved against the position, closing with the two largest single losses in the whole 8-year test, survived only because price reversed in time — happened three weeks ago, not in some distant, unrepeatable market regime. Custom Mode gives you more knobs to turn, but every one of those knobs still sits on top of the same “the cycle doesn't stop out, it waits” logic. More strategies running in parallel, if anything, means more simultaneous baskets that can each independently reach for that kind of drawdown.
Input Parameters of the Quantum Queen X

The backtest reports include the exact input set used for each preset, straight from the EA itself — not marketing language. Here's what's actually inside.
| Parameter | Default | Fixed lot | Fixed per balance | Very High Risk |
|---|---|---|---|---|
| InpLotsCalc (sizing mode) | 0 — Auto (risk-based) | 1 — Fixed lot | 2 — Fixed per balance | 0 — Auto (risk-based) |
| InpAutoLotsValue (risk level) | 3 | 3 | 3 | 6 |
| InpLotsFixed | 0.01 | 0.01 | 0.01 | 0.01 |
| InpLotsFixedBalance | 500.0 | 500.0 | 1000 | 500.0 |
| InpOrdersMax (basket cap) | 100 — identical across every preset | |||
| InpDDMode / InpDDValue (account-level drawdown protection) | 0 / 0.0 — disabled in every single test | |||
InpOrdersMax=100. The EA allows a single basket to grow to as many as 100 individual legs before anything caps it. The event covered above only needed 15 legs to produce the two largest losing trades in the whole 8.5-year test — the ceiling this EA actually operates under is more than six times deeper than that.
InpDDMode=0, InpDDValue=0.0, in all four presets, including the ones the developer actually ships and recommends. This is the account-level stop-loss switch — the one setting that could force the EA to stop trading and protect what's left of the balance if a drawdown gets bad enough. It's off by default. Nothing in the numbers above happens with any kind of floor underneath it; the only thing standing between an open basket and the account is whether price turns around before the basket runs out of room.
Other settings worth knowing about:
- InpSets and InpS01Strategy … InpS12Strategy — the Custom Mode toggles described earlier; each of the 12 strategies can be switched on or off individually
- InpTradingDirectionType=2 — trades both directions (long and short)
- InpUseNfpFridayFilter=true — pauses around Non-Farm Payrolls releases
- InpTradeOnMonday through InpTradeOnSunday — all set to true in every preset tested, including Saturday and Sunday
- InpSpread=100, InpSlippage=100 — maximum spread/slippage tolerance before the EA holds off on new entries
Conclusion
Quantum Queen X is a well-marketed, actively-supported successor to a product that appears to have run its course — same core grid engine, more configuration options, a fresh set of reviews still in their honeymoon period. The Fixed-lot backtest shows the underlying trade selection has real merit. But the Default preset that most buyers will actually run showed a 76.92% equity drawdown event in the final two weeks of an 8.5-year test, driven by exactly the mechanism the developer describes as intentional: individual legs are never stopped out, only the whole cycle is managed toward profit. The live signal, for all its “4,725% growth” headline, is built on an account that's absorbed over $13,000 in deposits against a $100 start, shows the same balance/equity gap as the backtest, and currently has zero subscribers and zero reviews.
Given everything above, I have real concerns that Quantum Queen X could eventually face something similar to whatever happened to Quantum Queen. Nothing about the underlying mechanics has changed enough to rule that out, and the near-miss I found in the most recent weeks of testing is a live illustration of exactly how that could play out. If you're considering this EA, please be extremely careful, run it on the most conservative settings you're willing to accept, and never fund it with money you aren't prepared to lose in full.
Elementary safety measures before you run this live:
- Test on a demo account through at least one full grid cycle — not just a few days of quiet market conditions
- Start with the Fixed-lot or lowest-risk preset; the Default and higher presets carry equity drawdown well beyond what the headline profit factor suggests
- Understand before you fund the account: individual “losing trades” you see in your history are not mistakes the EA is making — they are legs of a basket that will not be stopped out
- Withdraw profits regularly instead of letting auto-lot compounding scale your position size along with your balance
- Use a reliable VPS — this strategy can hold positions for extended periods and cannot tolerate a dropped connection
- Only use capital you are fully prepared to lose
For stable automated trading, I would recommend taking a look at the Gold Bundle
In the archive Quantum_Queen_X.rar (102 Kb):
- Quantum Queen X 4.3_fix.ex5
Free Download Quantum Queen X EA MT5 v4.3