Cluster Trader System - profitable trading by trend on the pullback
Cluster Trader System is based on the patterns of price movements as the most reliable source of information, as well as on several author's indicators. The system is simple and universal and is suitable for the Forex market, for trading futures on indexes NASDAQ, SP500, commodity assets (Oil, Gold) and cryptocurrencies on the minute and hourly charts.
Characteristics of the Cluster Trader System
- Platform: Metatrader4
- Currency pairs: Any currency pairs, indices (NASDAQ, SP500), stocks and crypto
- Trading Time: Any, recommended only New York trading sessions
- Time Frame: M1-H1
- Recommended broker: Roboforex, XM, FBS
System Indicators
Earlier I already reviewed this modified strategy under a different name, which was given to it by an unscrupulous seller. Today I want to pay more attention to the original version of the system.
Initially, it may seem that the strategy has several indicators, but all readings on the chart generates only one indicator, whose settings are mostly related to visual display and on/off alerts:
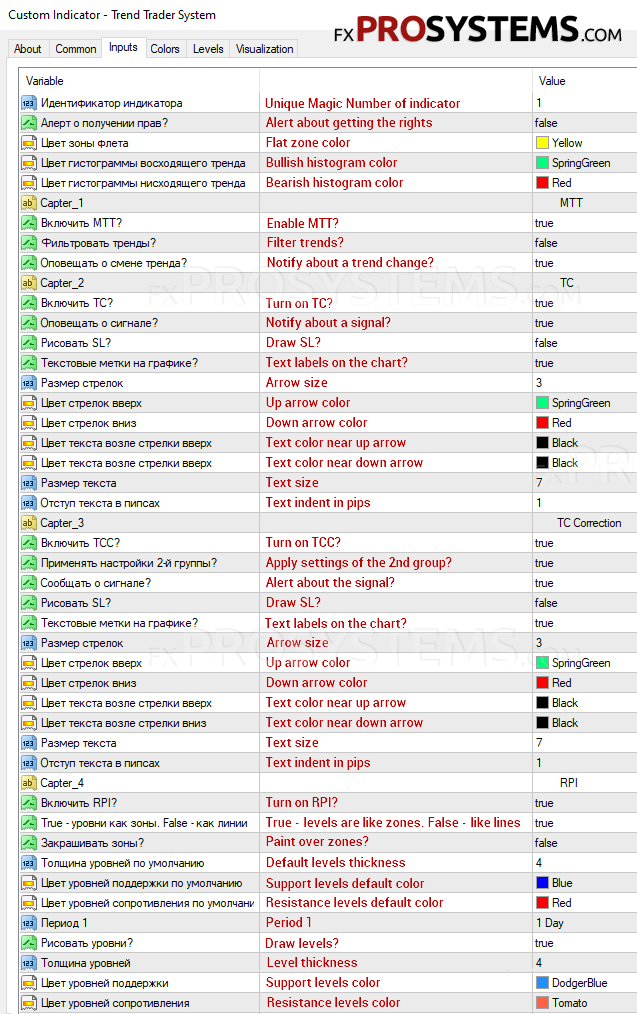
- Unique Magic Number of indicator = 1
- Alert about getting the rights = false
- Flat zone color = Yellow
- Bullish histogram color = SpringGreen
- Bearish histogram color = Red
Capter_1 = MTT
- Enable MTT? = true
- Filter trends? = false
- Notify about a trend change? = true
Capter_2 = TC
- Turn on TC? = true
- Notify about a signal? = true
- Draw SL? = true
- Text labels on the chart? = true
- Arrow size = 3
- Up arrow color = SpringGreen
- Down arrow color = Red
- Text color near up arrow = Black
- Text color near down arrow = Black
- Text size = 7
- Text indent in pips = 1
Capter_3 = TC Correction
- Turn on TCC? = true
- Apply settings of the 2nd group? = true
- Alert about the signal? = true
- Draw SL? = false
- Text labels on the chart? = true
- Arrow size = 3
- Up arrow color = SpringGreen
- Down arrow color = Red
- Text color near up arrow = Black
- Text color near down arrow = Black
- Text size = 7
- Text indent in pips = 1
Capter_4 = RPI
- Turn on RPI? = true
- True - levels are like zones. False - like lines = true
- Paint over zones? = false
- Default levels thickness = 4
- Support levels default color = Blue
- Resistance levels default color = Red
Period 1 = 1 Day
- Draw levels? = true
- Level thickness = 4
- Support levels color = DodgerBlue
- Resistance levels color = Tomato
Similarly for Period 2 = 1 Day; Period 3 = 1 Month; Period 2 = 4 Hours.
Therefore, if you want, you can change the colors of the levels, arrows and text, and for those who don't want to customize the chart and the indicator, you can download a template at the end of the article.
Although there is only one indicator in the Cluster Trader System strategy, it is subdivided into components (indicators "embedded" in the main indicator), which perform certain functions:
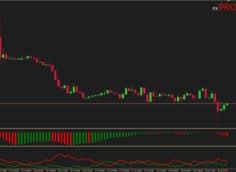
- Momentum Trend Trader (MTT) - the lower histogram, which determines the phases of the market, or rather shows which trend is prevailing on the market at the moment.
- Reverse Point Indicator (RPI) - is an indicator of levels on the chart, that won't redraw and works on any timeframes from M1 (1 minute) to W1 (1 week).
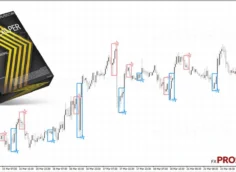
- Trend Change Correction (TCC) - is a signal indicator (indicated with an arrow and TCC text), which indicates by arrows the entry points for correction and is suitable for trading on the current movement and against it.
- Trend Change (TC) - is a signal indicator (marked with an arrow and text TC), which marks with arrows the main points for opening a deal on a trend or during the reversal.
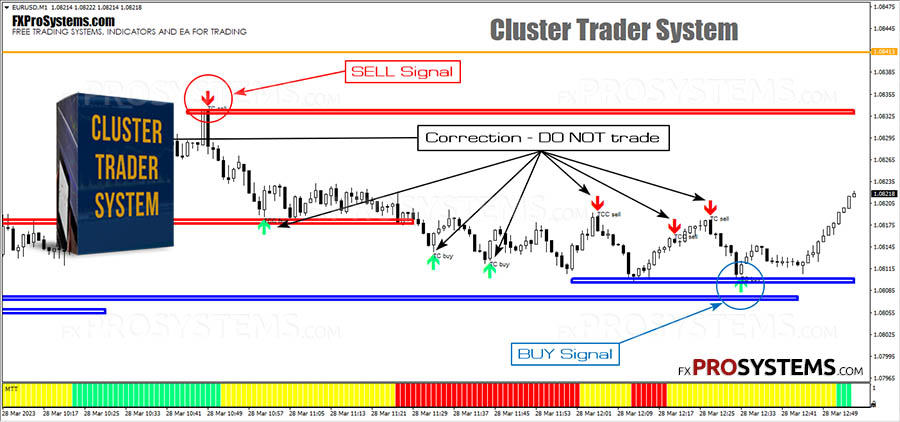
Trading Rules
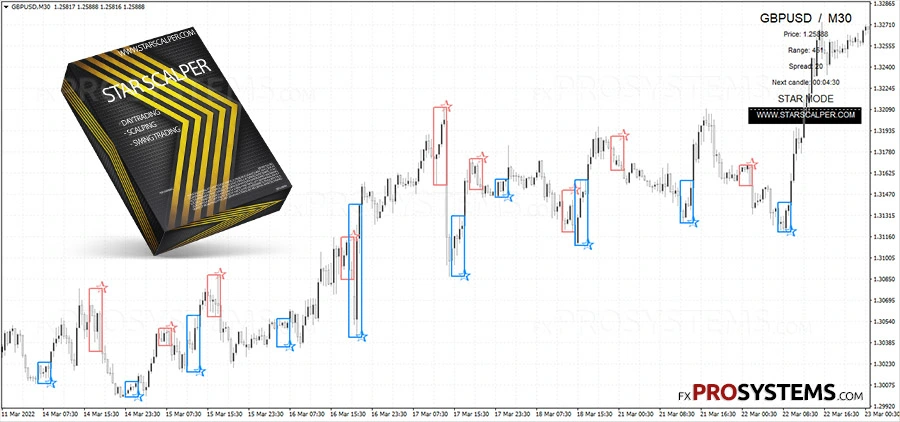
The rules of trading according to this strategy imply the similarity of signals from all indicators, and therefore to open a BUY deal it is necessary that:
- Not necessarily - the MTT indicator was green, which would indicate an uptrend
- The level, which the price will approach, must be blue (Support Level)
- A green arrow, with the text "TC Buy", must appear.
To open a SELL position it is necessary that:
- Not necessarily - the MTT indicator was red, which would indicate a downtrend
- The level, to which the price will approach, must be red (Resistance level)
- There should be a red arrow with the text "TC Sell".
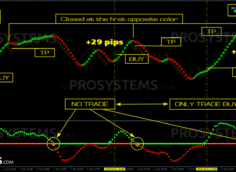
Examples of signals:
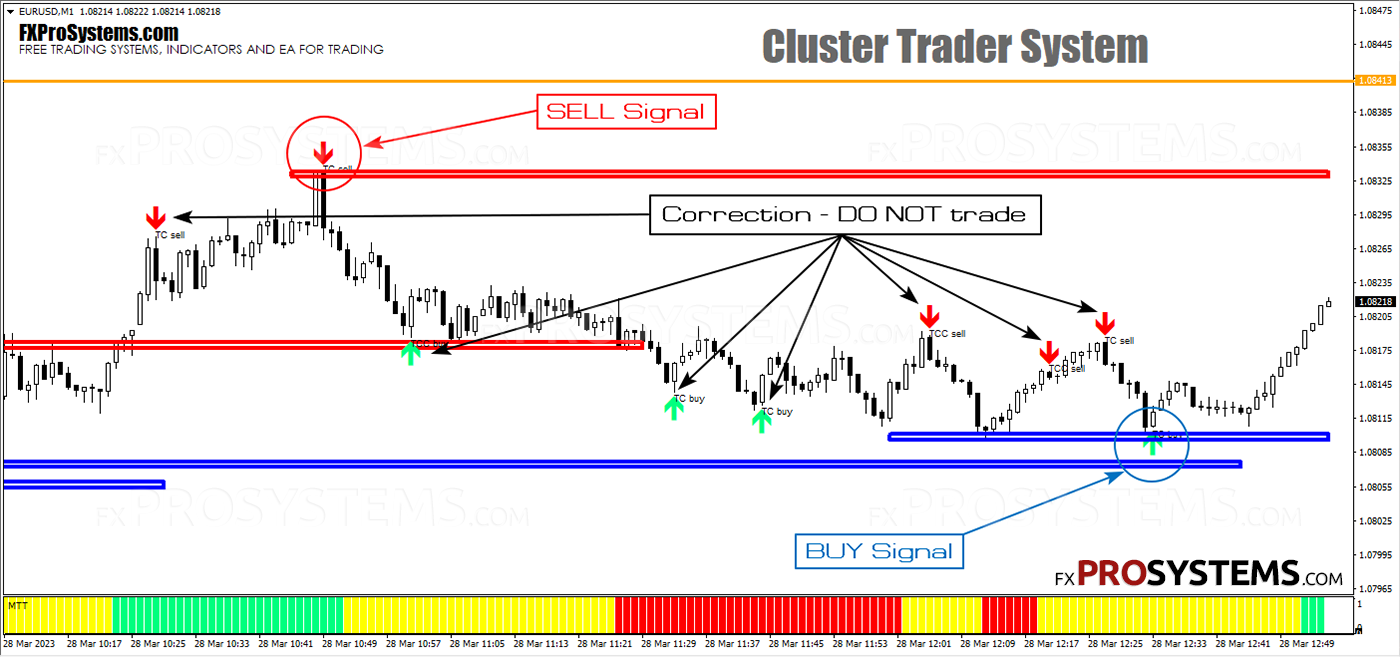

In the image above, you can see that the main signals are supported by levels, while corrections appear in the middle of the movement.
In addition to the standard trading rules, which are as simple as possible due to the signal indicator, the Cluster Trader System strategy also has simple trading recommendations:
- If the MTT indicator turns yellow, then the market is dominated by a flat and in that case you can trade only from the levels. The strongest levels are those which have not yet been broken through.
- When trading against the trend is not necessary to trade from the level, but the indispensable condition is the arrow on the TCC indicator (correction).
- Scalping transactions are also allowed, even though it carries an increased risk. With this approach it is possible to make transactions, but it should be understood that the strategy is designed to trade on the trend and the probability of getting a loss in this case is quite high. I highly do not recommend trading this way.
It is hard to say whether this strategy is worth its price, but there is no doubt that it can generate accurate signals to enter the market. In spite of this, it is worth to test it on a demo account, as well as to apply the correct Money Management.
In the archive Cluster_Trader_System.rar (239 KB):
- Trend Trader System.ex4
- Cluster Trader System Template.tpl
Free Download Cluster Trader System